Metrics Every Manager Should Track
As an engineering manager, you need to know which metrics to use and how to interpret them to keep delivery predictable and spot problems early.
A good metric helps you spot risks, make informed decisions, or start a conversation with your team. A metric that only tracks activity creates noise and can lead you to the wrong conclusions.
I use three groups of metrics in my daily work:
- Delivery metrics
- Backlog health metrics
- Product and platform health metrics
Together, they help me understand whether the team is delivering predictably, whether work is becoming blocked or outdated, and whether the product remains reliable.
Delivery Metrics
Delivery metrics show whether the team can finish work on time and whether the release plan still holds. I use them to spot risks early and plan capacity for the next milestone.
| Metric | What to track | When to act |
|---|---|---|
| Postponed deliveries | Items past target date | Count rises or the same causes repeat → retro (scope, estimates, dependencies, capacity) |
| Deliverables at risk | In-progress work near deadline | In progress, in review, or blocked → raise a flag and communicate proactively with the team and stakeholders |
| Work in progress | Active tasks vs team limit | Above healthy range → finish in-flight work before starting new |
| Workload distribution | Work spread across the team | Spot overload, uneven ownership, or who can take on more work |
| Release capacity | Realistic person-days for the milestone | Subtract vacations, reviews, meetings, support, and maintenance; not developers × calendar days |
| Open merge requests | Count, average age, MRs older than threshold | Age or count spikes → review bottlenecks or forgotten changes |
Burndown Chart
A burndown chart shows planned scope, the ideal execution trajectory, and remaining work over the release.
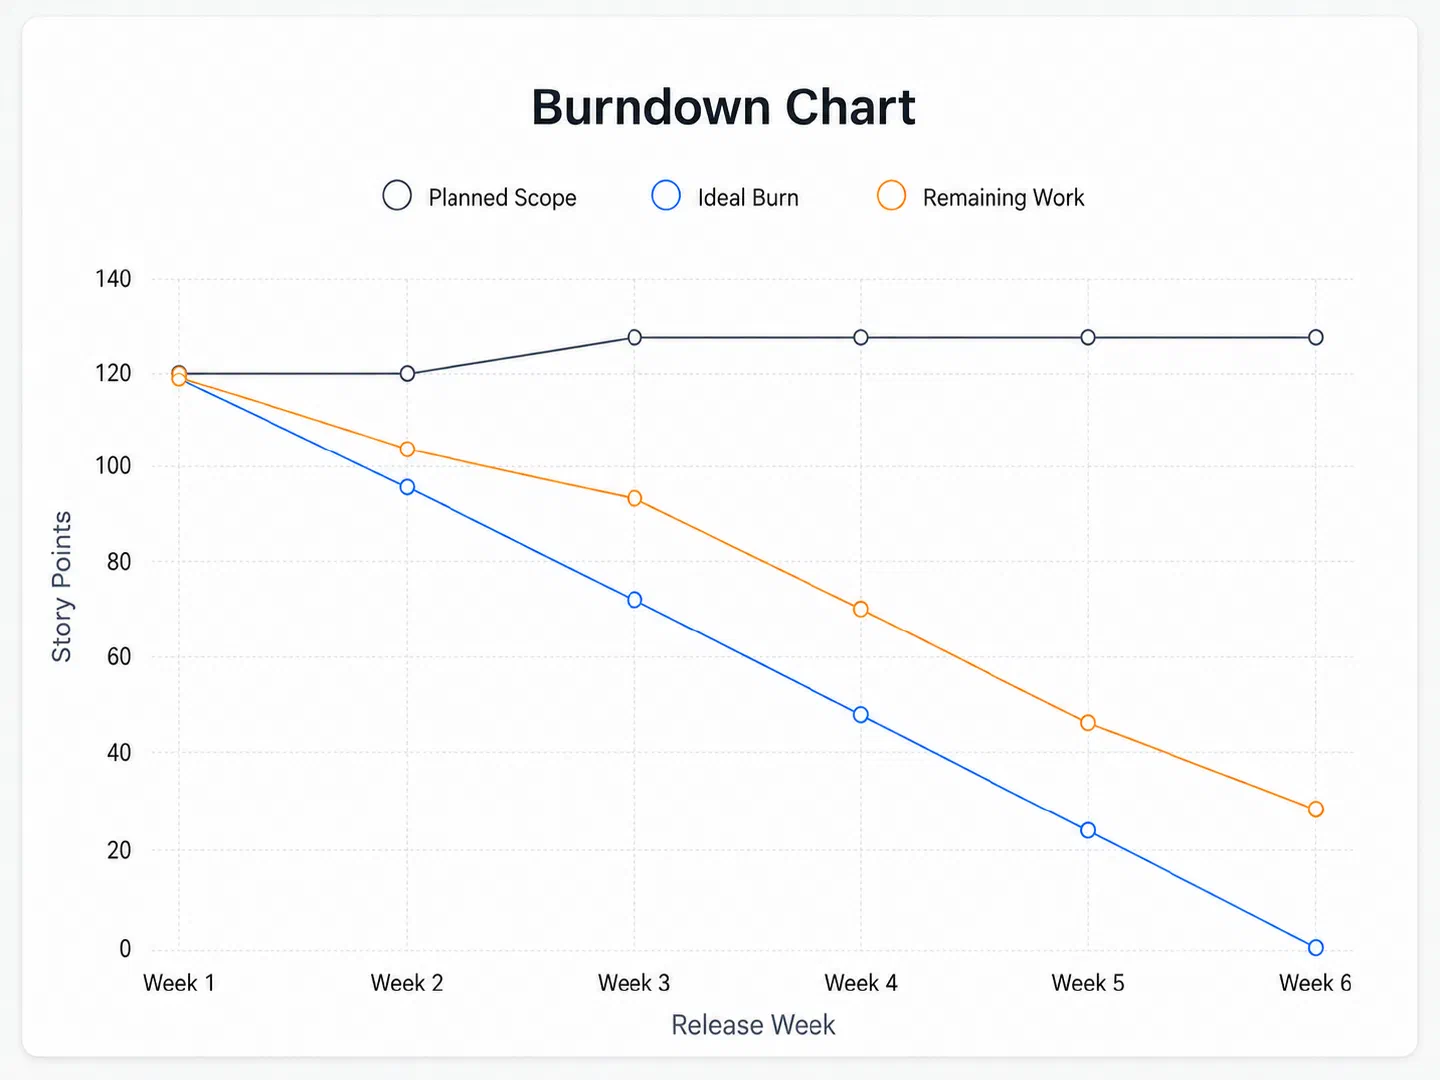
Use it during execution to see whether the team is on track. It also makes scope creep visible when the release scope grows mid-cycle.
Release Issue-Type Ratio
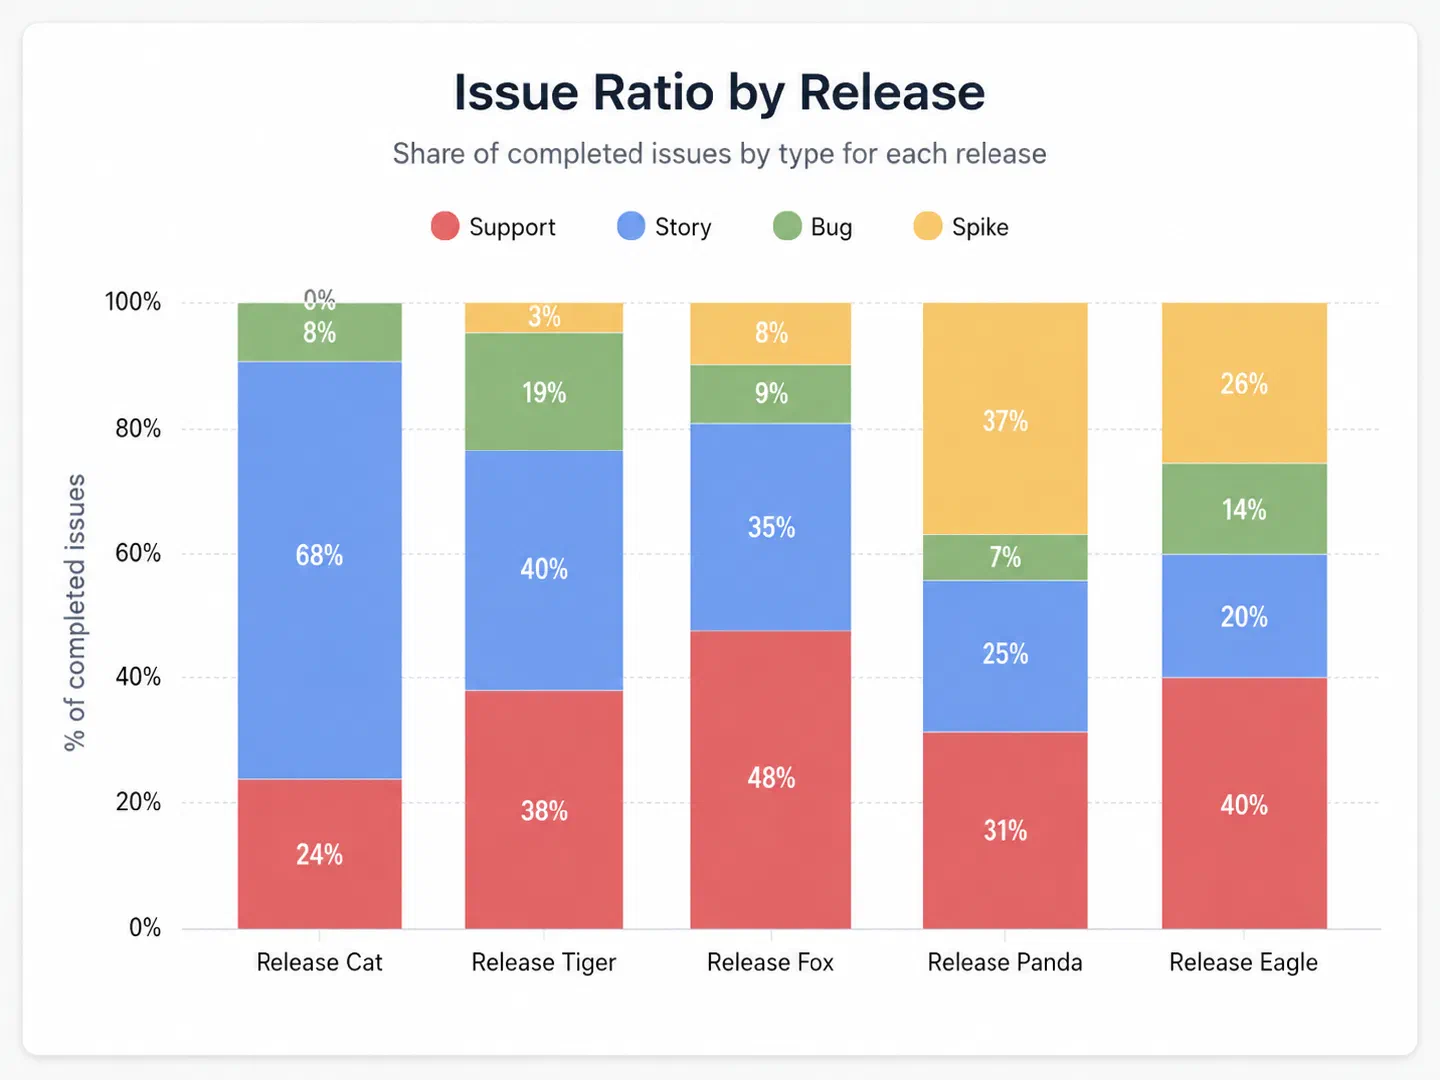
Track the percentage of features, bug fixes, and technical debt addressed in each release (for example, 60% features, 30% bug fixes, 10% technical debt). I usually monitor the last 10 releases so stakeholders understand that delivery includes more than just new features.
Velocity Across Recent Releases
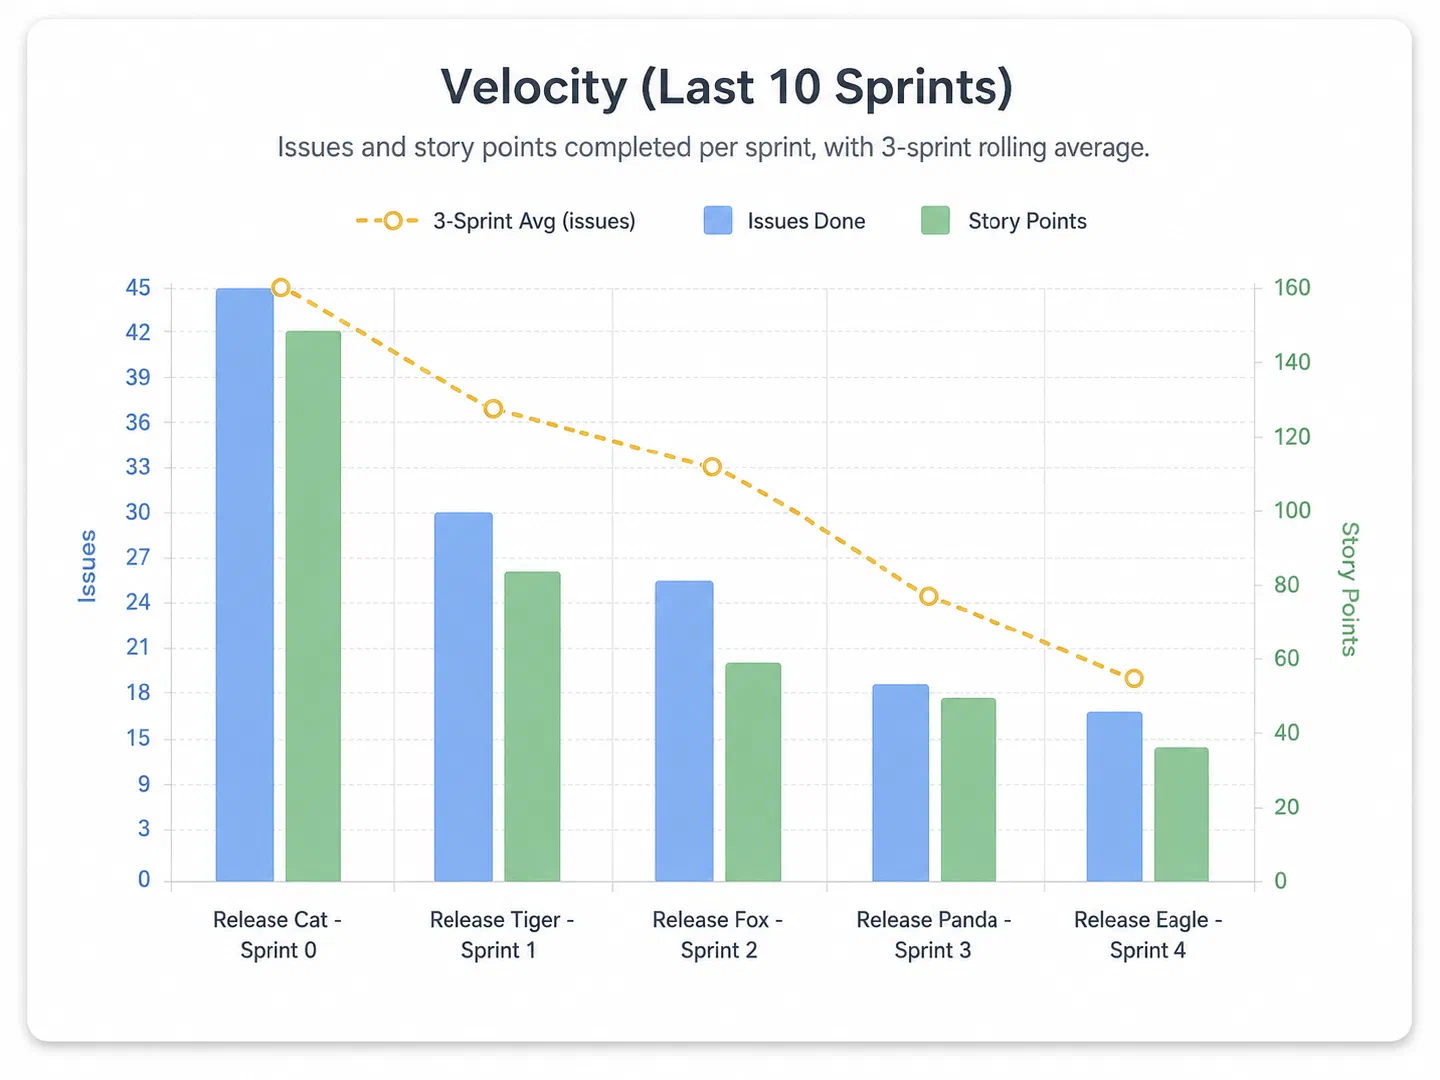
Velocity means tracking the number of story points completed in each release cycle. What matters is the trend over time and the average from the last three releases — not the number from a single sprint. This shows whether the team’s delivery rate is stable, improving, or slipping. Velocity is useful for forecasting and planning capacity.
AI Adoption
Most teams are still learning how to use AI well.
One useful metric is the percentage of team members who use AI tools during a development cycle. This can be compared with changes in delivery speed, review time, bug rates, or other relevant outcomes.
For example, three out of five developers used AI regularly during a release. You can then examine whether any meaningful changes appeared in delivery or quality.
This comparison does not prove that AI caused an improvement. Release complexity, team composition, technical debt, and scope quality may also influence the result. However, it gives managers a useful starting point for evaluating where AI helps and where it does not.
This should not be confused with maximizing token usage. More tokens do not automatically create more value.
Our industry is full of claims about “10x engineers.” Based on real project data, you can directly examine the actual productivity gains from using AI and determine whether the cost of AI tools — are justified.
Backlog Health Metrics
Backlog Graveyard
Track items that have not been updated for a defined period.
The threshold depends on the product. For a fast-moving startup, it might be 90 days. For a large corporate platform, it could be 365 days or longer and still be considered healthy.
However, the idea is as follows: If an item hasn’t been discussed, updated, or worked on for an extended period, it may no longer reflect a current product need. The team can decide to remove it, revise it, or change its priority.
Average Age by Issue Type
Track the average age of each type of backlog item separately.
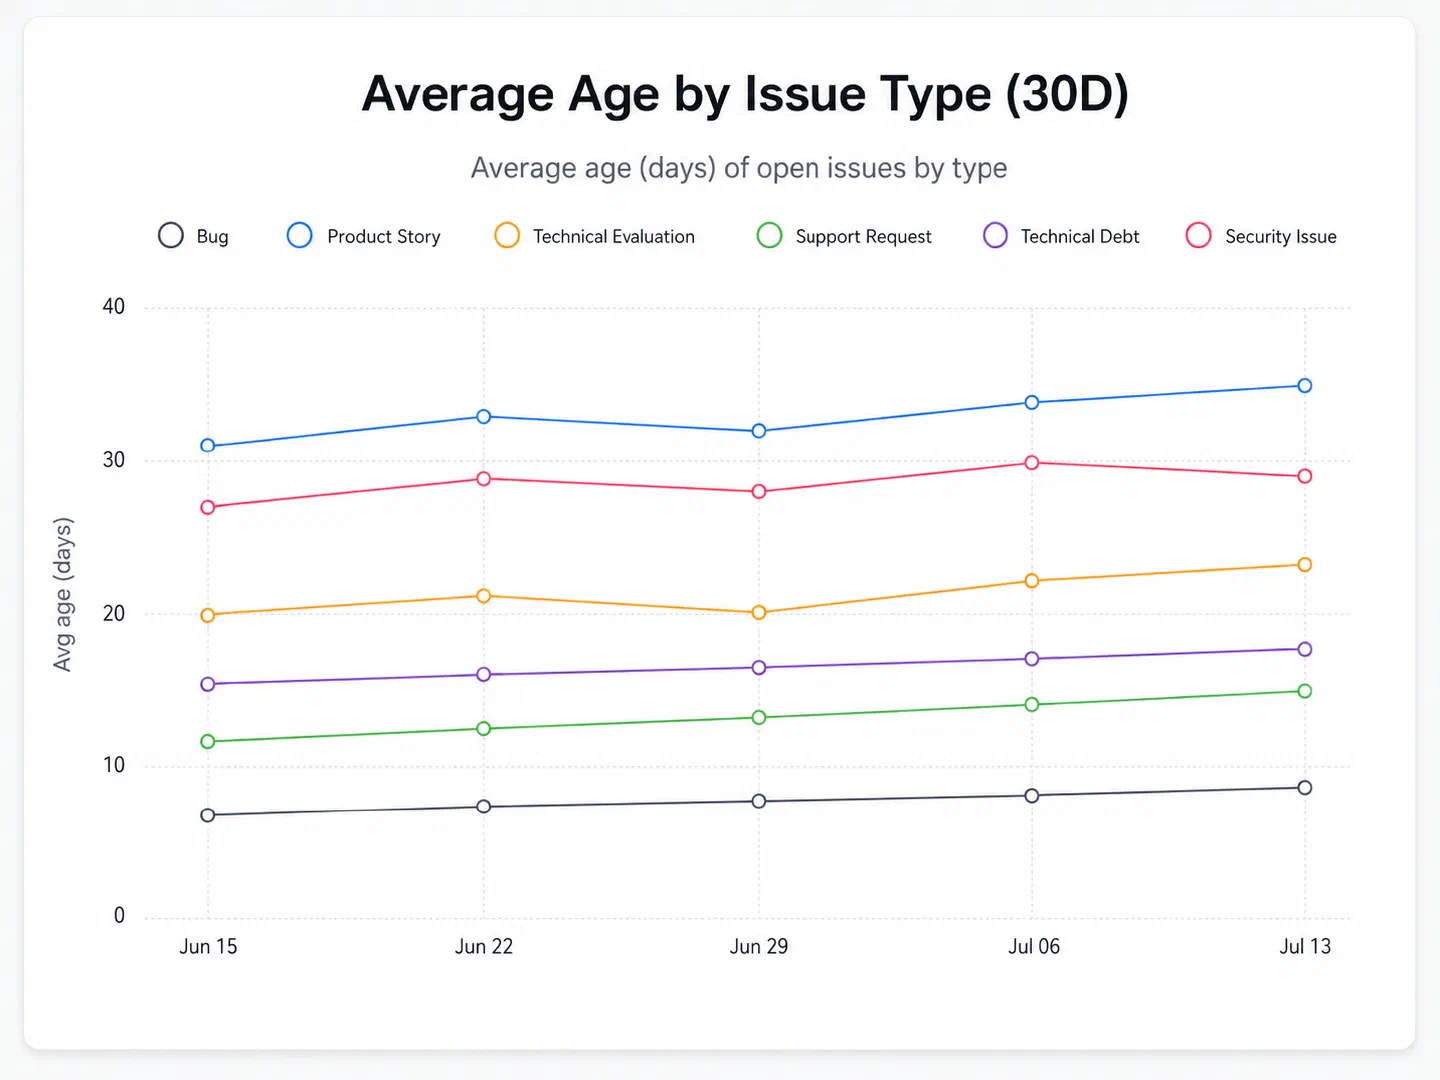
This may include:
- Bugs
- Product stories
- Technical evaluations
- Support requests
- Technical debt
- Security issues
A single average across the entire backlog can hide important problems.
For example, product stories may move normally while support requests remain unresolved for months. If the average age of one issue type keeps increasing, it usually means the team is not allocating enough attention to it.
Average Time in Status
Track how long work remains in each workflow status.
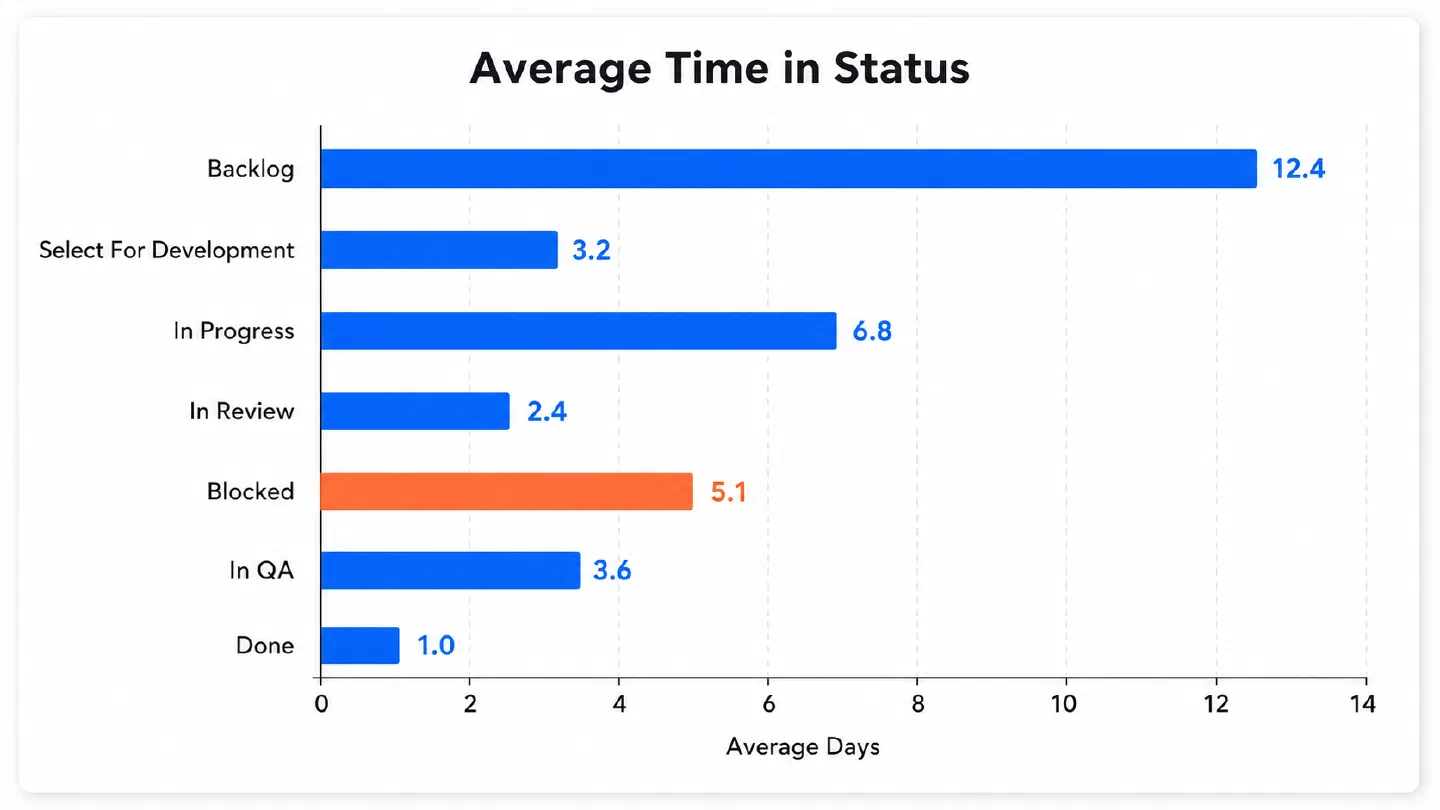
This helps identify where delays originate.
Implementation may be fast while the review stage takes several days. Work may stay blocked by another team. Testing may become a bottleneck near the end of every release.
This metric helps you optimize the SDLC and identify the right bottlenecks.
Created Versus Resolved
Compare the number of items created with the number resolved during the same period.
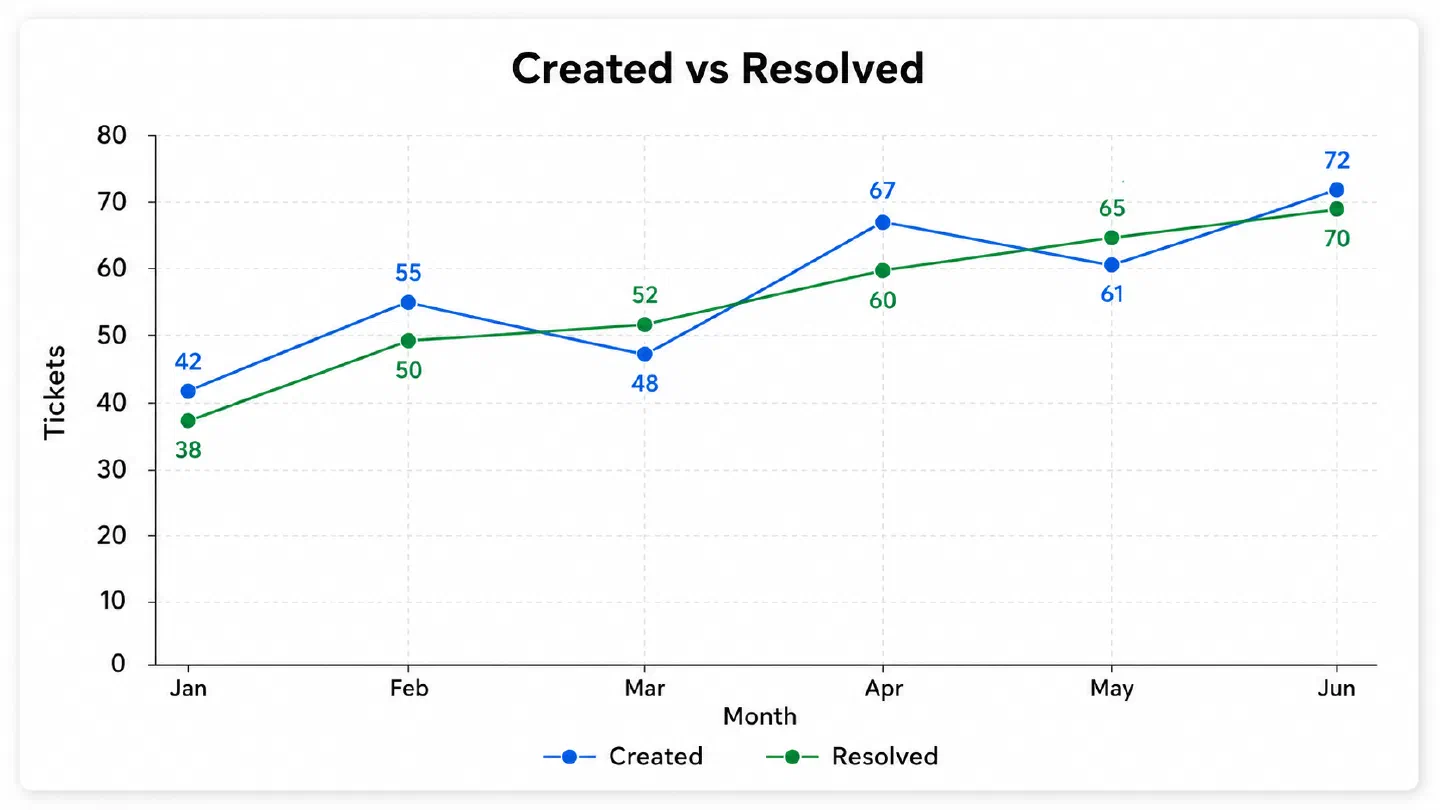
This chart surfaces useful backlog signals:
- Resolved exceeds created — good time for planning and backlog refinement. The team may run out of committed work soon, so look ahead for what comes next.
- Created exceeds resolved — the backlog is growing. Common causes:
- Higher demand or insufficient team capacity (useful when arguing for new hires)
- Poor prioritization or weak backlog validation
- Team underperformance — compare with velocity and burndown charts before drawing that conclusion. In this case, run a retro, review process blockers, and gather feedback from the team.
The value of the metric is that it makes the trend visible.
Product and Platform Health Metrics
There’s no universal metrics to define product as healthy, every product has it’s own critical paths, areas and requirements.
However, there are a set of techinics and frameworks that you can use to implement your own tailored metrics with Service Level Agreement(SLA), Service Level Objective(SLO) and Service Level Indicator(SLI).
At first you need to define SLA, think of it as a contract beetween you and your end customer. Define what do you promise to end customers, what critical paths you have to cover.
For example, Latency for adding product into the cart withing 200ms, or 99.95% of service availability or sending sign up email within 1s. Define your own critical paths and make it a part of Service Level Agreement.
Typical SLA might include:
- Service availability.
The service must maintain at least 99.9% monthly uptime, excluding planned maintenance. - Critical incident response
Priority 1 incidents must receive an initial response within 15 minutes. - Critical incident resolution
Priority 1 incidents must be resolved or mitigated within 4 hours. - Standard support response
Support requests must receive an initial response within 8 business hours. - API response time
At least 95% of API requests must complete within 500 milliseconds. - Backup frequency
Production data must be backed up at least once every 24 hours. - Planned maintenance notice
Customers must receive at least 72 hours’ notice before planned maintenance that may affect availability.
Once you have an SLA, break each item into Service Level Objectives (SLOs): internal targets your team owns day to day.
Each SLO needs a Service Level Indicator (SLI) that you can measure. SLIs tell you what is happening now. SLOs tell you whether you are still inside what you promised. The SLA is the boundary you cannot cross without consequence. This chain keeps product health metrics tied to customer expectations instead of generic infrastructure charts.
When an SLO is not met, you need more than a metric that shows the current value. You also need an alert configured to trigger action and a quick fix.
Metrics That Should Not Be Used as Productivity Measures
Some metrics show activity but say very little about customer value or engineering effectiveness.
| Metric | Why it misleads | Track instead |
|---|---|---|
| Commits per developer / Merge requests created | Depends on working style, task structure, and team conventions. More activity != more useful work. | Delivery outcomes, workload distribution. Track open MR count and average age to detect review bottlenecks. |
| AI tokens used | Shows usage and cost, not whether AI improved delivery, quality, or decisions. | How often your team uses it and how that correlates with velocity. |
| Lines of code | Rewards code changes, not value or impact. AI can produce thousands of lines per day while shipping only a few features. | Customer value and business impact. |
Metrics Are a Tool for Insightful Action
The goal is not to collect as much data as possible. The goal is to notice problems earlier, make better decisions, and help the team deliver better results.
I use these metrics to understand delivery risks, process bottlenecks, overloaded areas, backlog problems, and changes in product health.
Metrics are a starting point—they highlight where attention is needed, but not always the reasons behind a problem. To truly drive improvement, review metrics collaboratively with your team, engage the right stakeholders, and dig deeper together to uncover the real root causes. Actionable insight comes from thoughtful discussion, not just numbers alone.
If you want to turn these signals into team goals with clear ownership, read my guide on how people managers can use OKRs.